This website uses cookies so that we can provide you with the best user experience possible. Cookie information is stored in your browser and performs functions such as recognising you when you return to our website and helping our team to understand which sections of the website you find most interesting and useful.
Why is the DLC requiring submitters to use the Hort Pre-submission Tool to generate SQD and PPID images?
Per the Horticultural Technical Requirements, the DLC will create and display spectral and distribution images representing product-level performance for tested products using submitted ANSI/IES TM-33-18 .xml data. These images will allow Hort QPL users to better understand product level performance of tested horticultural luminaires. The Hort Pre-submission Tool produces a consistent format for images and implicitly connects test data to the images shown, which improves the QPL user experience and mitigates potential confusion for QPL users.
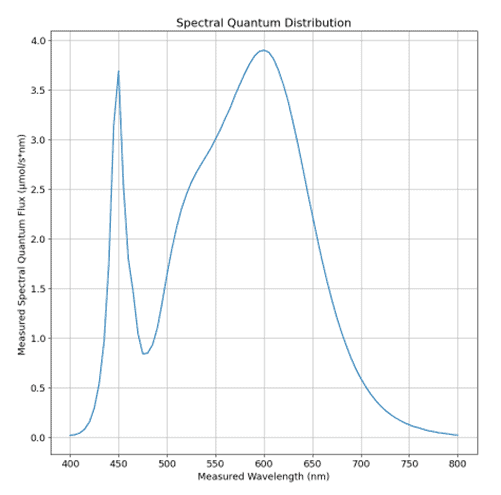
These images depict the horticultural luminaire’s photon flux distribution over wavelength (i.e. the spectral quantum distribution (SQD)) and the distribution of photon flux intensity over the tested horizontal and vertical angles (i.e. photosynthetic photon intensity distribution (PPID)) allowing QPL users to see the spectral and spatial distribution of each tested product in a consistent format. Images are square and measure 1000 pixels by 1000 pixels. On the QPL, users will be able to click on the images to view them in a larger format.
The Hort Pre-submission Tool was designed by the DLC for use by manufacturers who intend to submit Hort V2.1 or later products for qualification to the DLC Hort QPL, and is required for V3.0 submissions. This tool processes one TM-33 .xml document at a time, and then generates an SQD or photosynthetic photon intensity distribution image in .png format for use as part of the submission process. Each image file uses a consistent format specified by the DLC, described in more detail below. The tool also validates the uploaded document to DLC and ANSI/IES TM-33-18 requirements. This helps submitters streamline the application process by identifying missing information in their files and generating an error message. This allows corrections to be made prior to submittal, and potentially reducing questions and necessary modifications after an application is submitted.
About the created images
The SQD images are generated from the uploaded TM-33 .xml documents, and will look like the image shown in Figure 1. Wavelength data is plotted from 400 nm to 800 nm, unless the wavelength range is larger, in which case the full submitted wavelength range will be plotted (e.g. if PBAR range is reported and tested, corresponding SQD should be generated to plot the full tested range (280 nm to 800 nm). TM-33 .xml radiant flux data will be converted to photosynthetic photon flux in µmol/s.
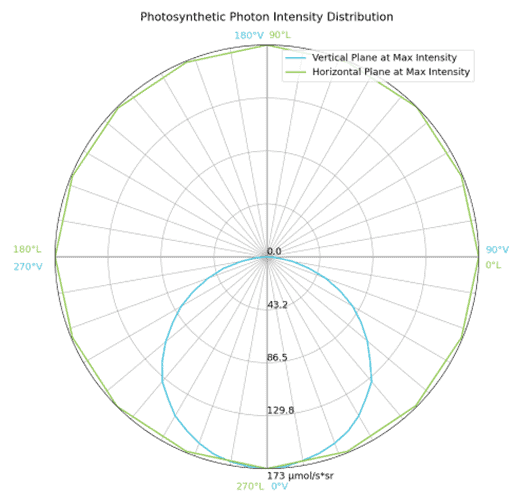
The PPID images are generated from the uploaded TM-33 .xml file. Figure 2 shows an example PPID image. The images are plotted on a polar axis, with the maximum intensity represented at the outer ring. Two planes that intersect at the maximum photosynthetic photon intensity value are plotted. The horizontal plane, plotted as a green line, displays the PPID at its widest lateral point (i.e. through the max intensity where the red line intersects the outer circle). This is a top-down or birds-eye view of the intensity distribution, and each cardinal axis in the circle shows a corresponding lateral angle in green text (00 L, 900 L, 1800 L and 2700 L). The vertical plane, shown in blue, displays a side view of the PPID sectioned through the max intensity at the widest lateral point. In Figure 2, the maximum intensity occurs at multiple points including 0 degrees laterally, 90 degrees laterally, 180 degrees laterally and 270 degrees laterally (i.e. 00 L, 900 L, 1800 L, and 2700 L, respectively), and the section cut could therefore taken through multiple vertical planes, such as the 00 – 1800 vertical plane. In the section view, where the blue line is shown, 00 V occurs at nadir (the point directly below the center of the luminous opening), the horizon line occurs between 900 V – 2700V, and zenith occurs at 1800 V (the point directly above the center of the luminous opening).
Many manufacturers typically elect to create intensity distribution images that typically show two vertical planes (e.g. the 0 – 1800 V plane and 90 – 2700 vertical planes) and no horizontal plane. Horticultural luminaires that have their maximum photosynthetic photon intensity at a lateral angle that is not coincident with either of these two planes would, therefore, not show the vertical plane through the maximum intensity. This would be evident because the vertical planes would not intersect the outer ring. This missing information can lead to a misunderstanding of the products distribution performance and could lead to misapplications of products. The images generated by the Hort pre-submission tool contain this potentially valuable information and, therefore, always include vertical planes through the maximum photosynthetic photon intensity.
The DLC intends to continue developing and introducing similar tools and processes to support industry standards, and to better enable consistency of review, to ensure better data integrity and to improve the overall QPL user experience.
Share this


Leave a comment
© 2023 DesignLights Consortium. The DesignLights Consortium is a project of Efficiency Forward, Inc., a non-profit 501(c)3 organization. Privacy Policy Terms of Use